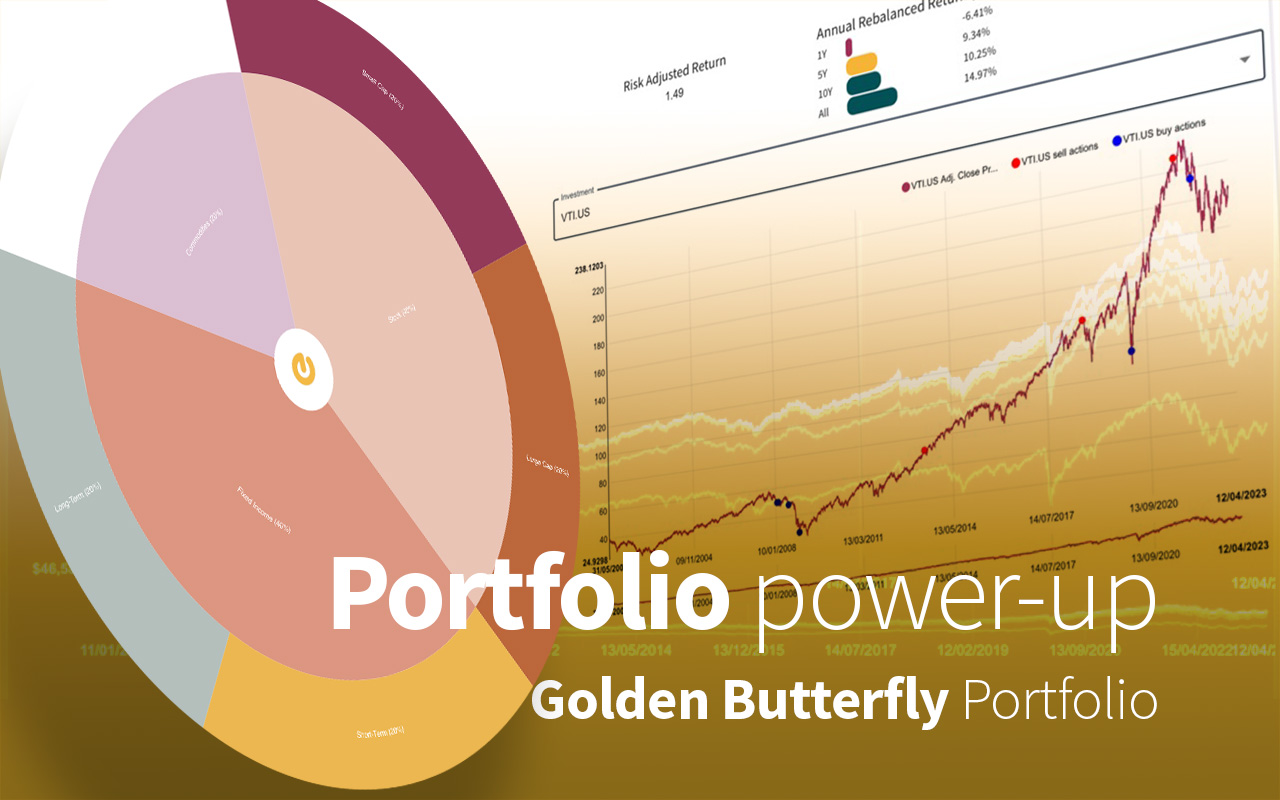
Equily’s sophisticated portfolio design and optimization tools make it easy to discover the rebalancing premium – no matter how simple or complex the portfolio. Our mission is to reward investors by discovering superior portfolio returns without requiring additional capital or risk.
In this article we’ll unpack the Tyler Golden Butterfly portfolio, created by the founder of Portfolio Charts website. We modelled Tyler’s Golden Butterfly using the equily Portfolio Design features and then optimized returns using Power-Ups.
The portfolio consists of the following 5 asset types:
- 20% Small cap equities
- 20% Large cap equities
- 20% Long term bonds
- 20% Short term bonds
- 20% commodities (gold).
We assume the “gold” in Tyler’s Golden Butterfly gets its name from the fact that a fifth of the portfolio is invested in the precious yellow metal. Also, when you plot it on a pie chart it looks a bit like a butterfly. See picture further below.
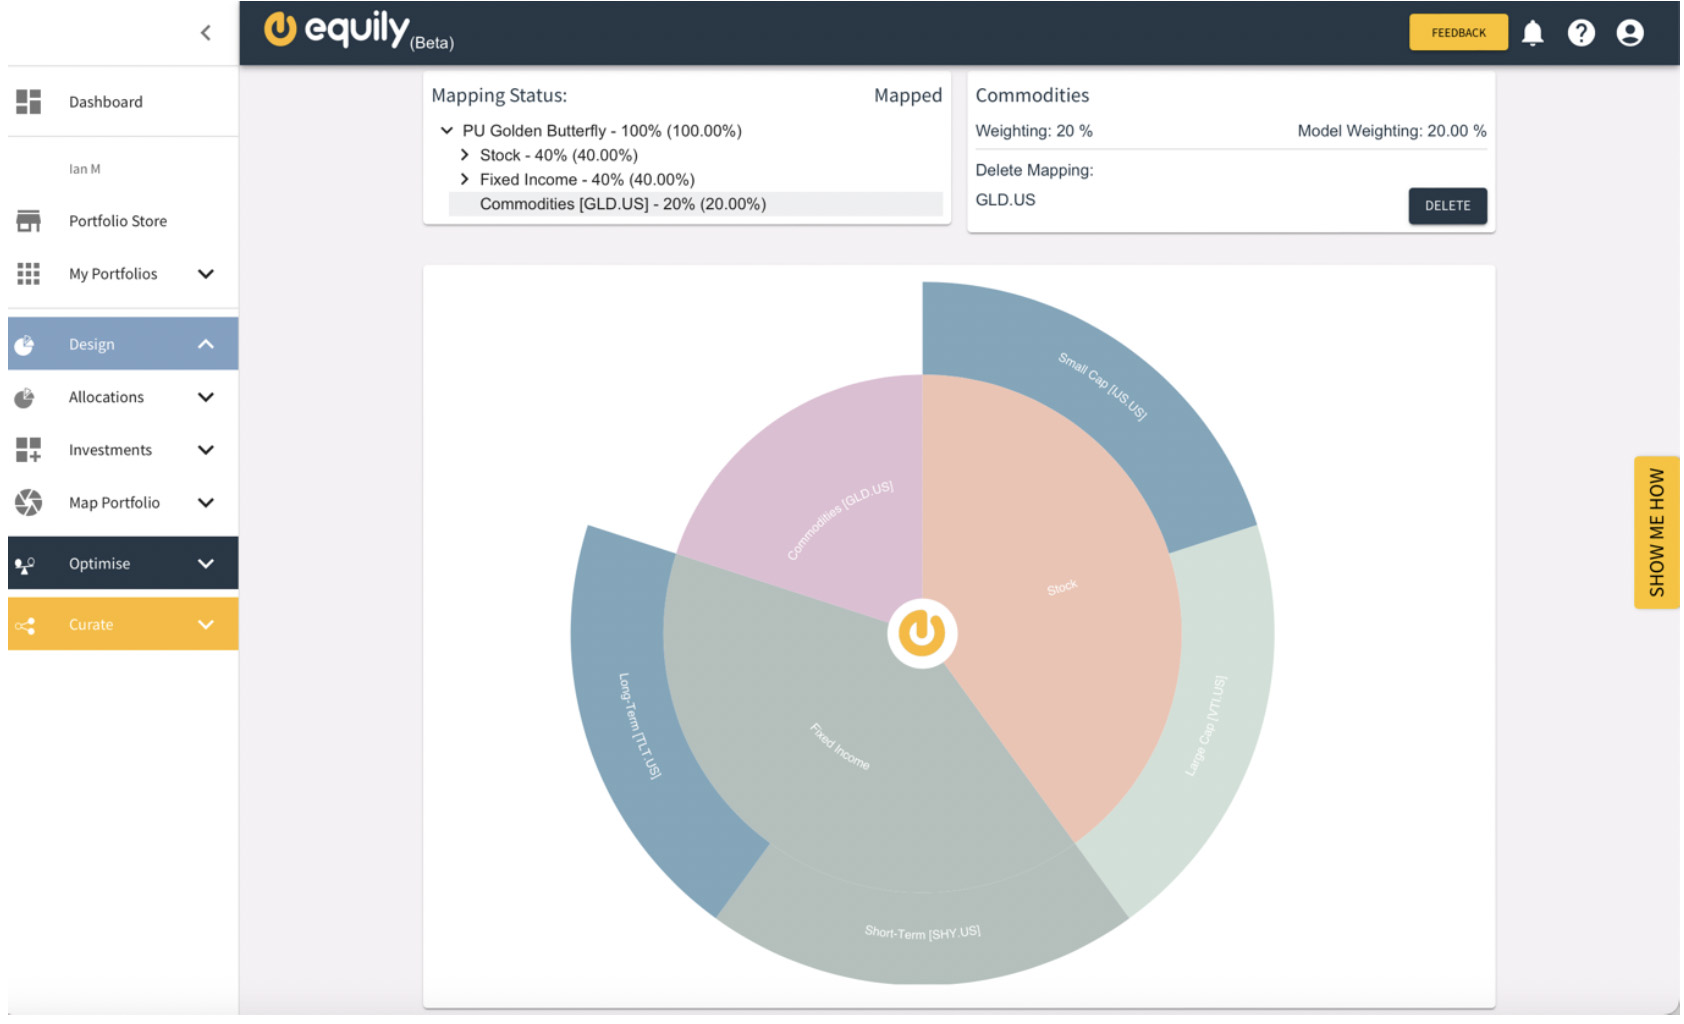
Diagram 1: The Golden Butterfly portfolio re-created in equily
The Winning Power Ups
Once designed, we used equily portfolio optimization features to run 5 different Power-Up strategies across 61 unique scenarios. In total we executed over 10,000 simulated trades dating back 19+ years to November 2004 to discover the rebalancing premiums hidden inside the Golden Butterfly. The end-to-end exercise takes around 1 hour, so it’s relatively easy.
All Power-Ups were given a starting portfolio of $100,000. The winning power-ups for the Golden Giants by category are as follows.
- Risk Adjusted Return: Best Performed is the Relative Power-Up
This category is for the best Risk Adjusted Return (RAR), which is a calculation of the profit from an investment portfolio that considers the degree of risk that must be accepted to achieve it. A widely held industry standard also known as the Sharpe Ratio.

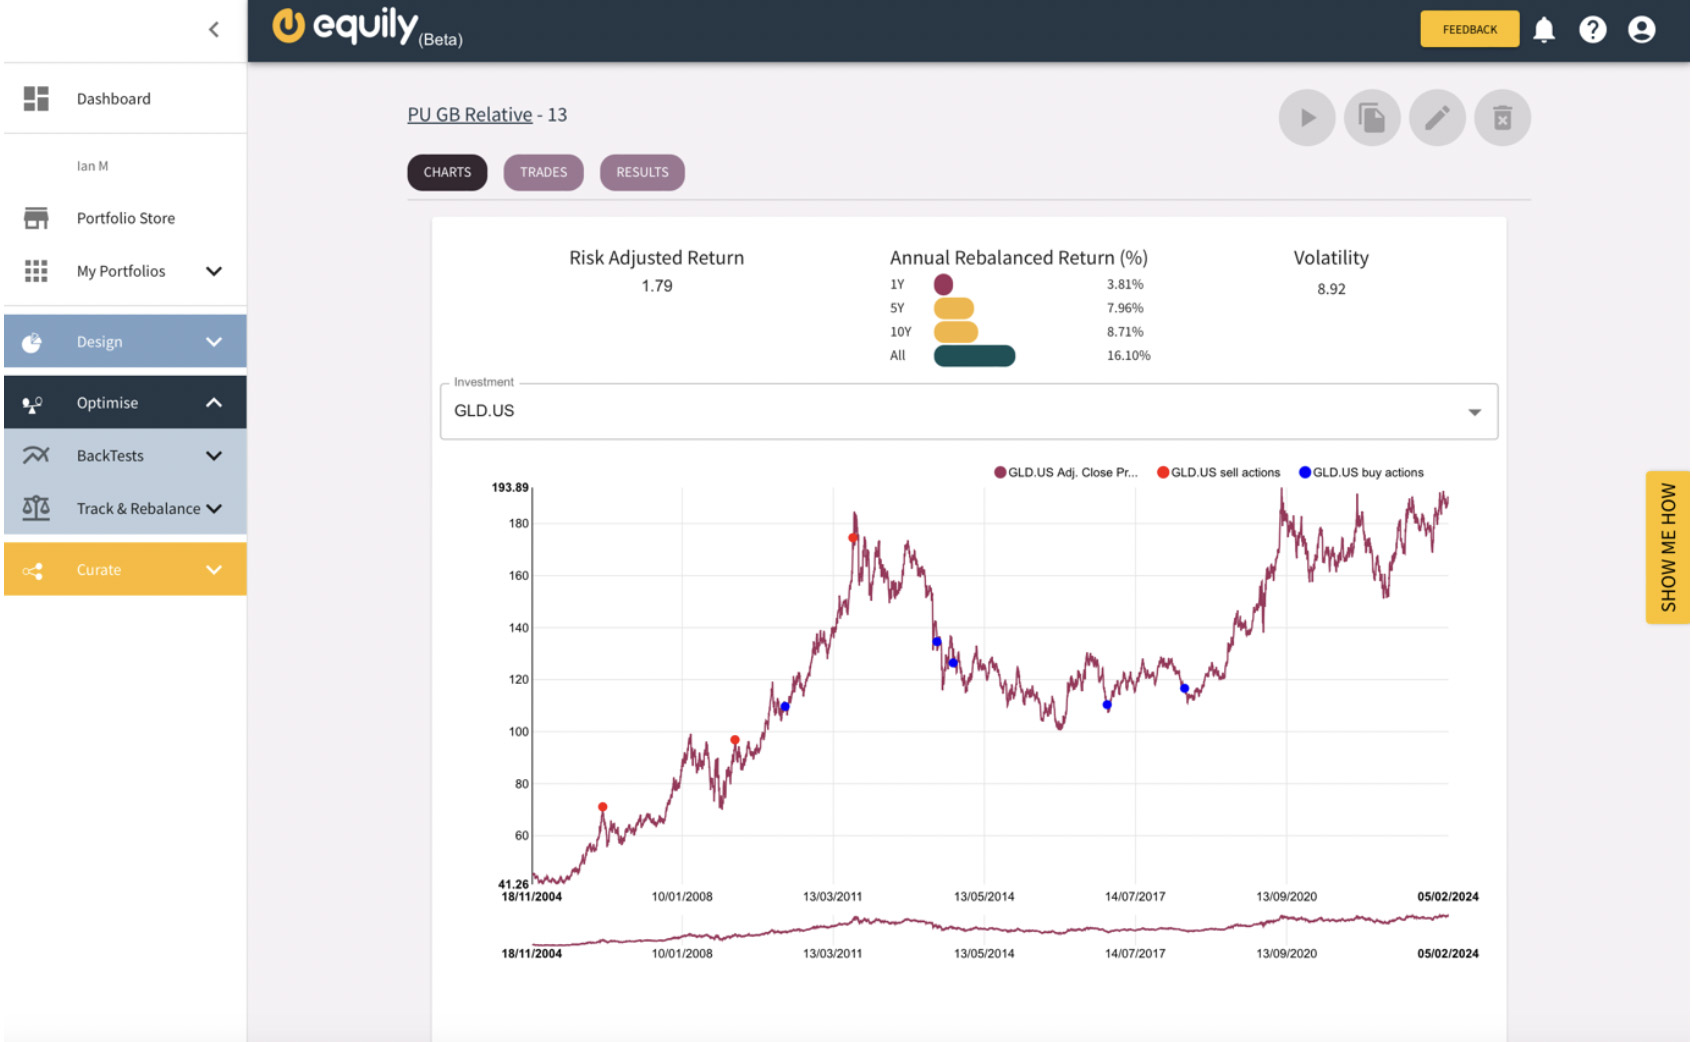
In summary, the equily Relative Power-Up created a 46% improved return on the original investment over a 19-year period using 33 trades (less than 2 per year). If you had invested $100,000 that would equate to an additional $46,000 rebalancing premium on top of the buy-and-hold strategy return of $259,300 giving you a total profit of $305,528. Meaning your final pot of money would be $405,528 rather than $359,300.
From a risk perspective, interestingly the equily Relative Power-up would have done this for less risk than a default buy-and-hold strategy; 8.92 vs 9.73% volatility respectively. More money for less risk, what is not to like about that?
Below is snapshot of the trades simulated by the equily Relative Power-Up:
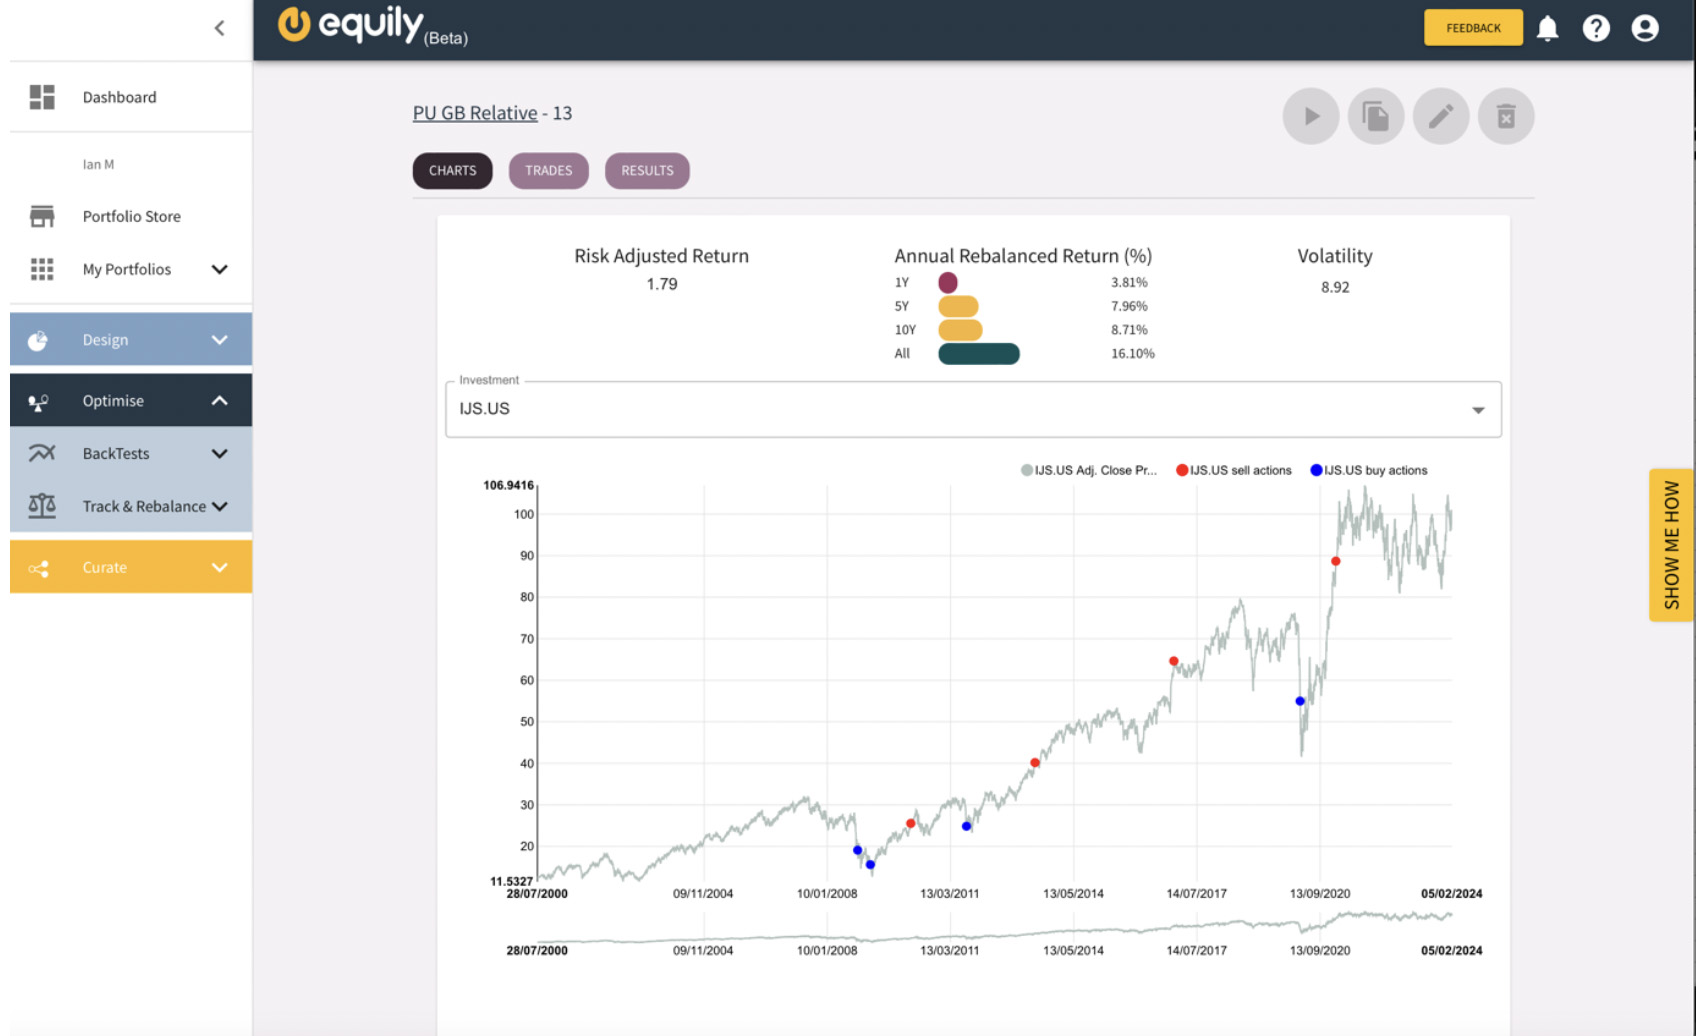
Diagram 3: equily Relative Power-Up – viewing the buys and sells of S&P 500 Small Cap (IJS)
2. Profitability: Best performer is the Absolute Power-Up
This category is for the best portfolio profitability. A simple calculation of looking at profit only and ignoring risk.

In summary, the equily Absolute Power-Up created a 60% improved return when tuned for profitability and did so with just 10 trades. If you had invested $100,000 that would equate to an additional $60,179 rebalancing premium on top of the buy-and-hold strategy return of $259,300 giving you a total profit of $319,479. Meaning your final pot of money would be $419,479 rather than $359,300.
Interestingly the volatility for the Absolute Power-Up is only marginally greater than the original buy-and-hold strategy; 9.92% vs 9.73%. The results indicate you would not be taking on significantly greater risk by this profitability-focussed strategy.
3. Volatility: Best performer is the Value Power-Up
This category is for the least volatility or risk. A simple calculation that purely focusses on volatility and ignores return. For these results, we must bear in mind the success criteria for a Power-Up i.e. it must improve investor returns.

Whilst the equily Relative and Time Power-Ups created the least volatile returns overall, they failed to deliver a profit greater than the original Buy-and-Hold strategy. Therefore, they are eliminated from the results. As such the category winner is Value Power-Up. It created a slightly better return than the Buy-and-Hold strategy, bearing in mind that all trading costs are factored. Importantly it did so with much lower volatility of 14.33% vs 15.84%. By comparison this is below the average stock volatility of 15%.
Summary
The Tyler Golden Butterfly is a well-designed portfolio that can be optimized further using equily Portfolio Power-Ups depending on your growth objectives and risk appetite. Based on our Portfolio Optimization testing, it is possible to squeeze up to 60% more returns for a marginally increased risk (0.2%) than a Buy-and-Hold strategy.
For those seeking a balanced growth vs risk approach, focussing on risk adjusted approach would generate 46% improvement and reduce volatility by c0.8%. A double win; more returns for less risk.
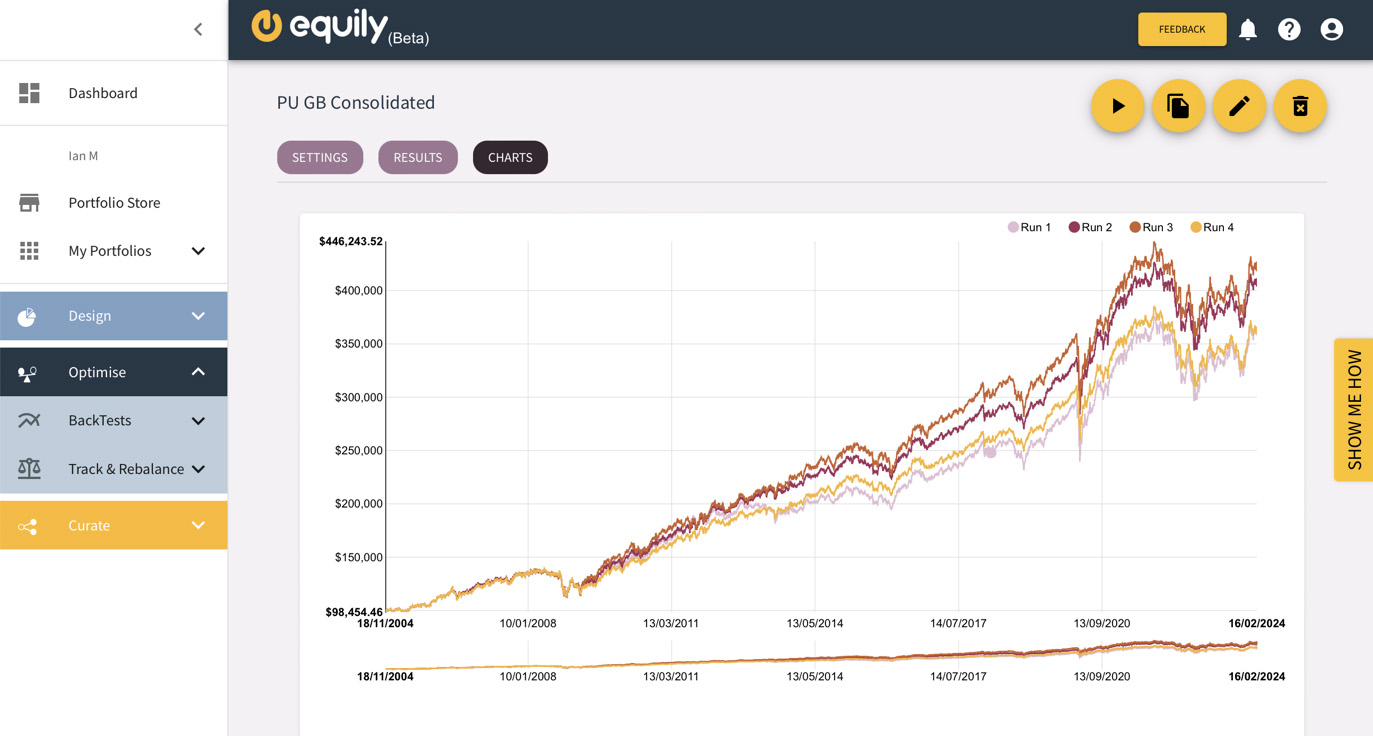
Diagram 1: Golden Giants – Consolidated comparison of returns (Run 1: Buy-and-hold, Run 2: Best Risk Adjust Return, Run 3: 2nd Best Profitability, Run 4: Lowest Volatility)
What is Smart Rebalancing using equily? And how does it reward investors?
A successful rebalancing strategy creates what we call a rebalancing premium. This premium is essentially “hidden value” that sits inside a portfolio. equily smart rebalancing algorithms calculate the optimum point to buy and sell assets in a portfolio with the objective of creating superior investor returns without additional risk or capital beyond the initial lump sum.
Sounds magic, right? Well, portfolio rebalancing is baked in science. In fact, Nobel Prize research by economist Harry Markowitz in what is known as Modern Portfolio Theory (MPT).
There’s no such thing as the perfect investment but crafting a strategy that offers high returns and relatively low risk is a priority for any investor. We believe smart portfolio rebalancing, deployed correctly, is fundamental to achieving this outcome.
At equily, we call our smart rebalancing algorithms – Portfolio Power-Ups. A successful Portfolio Power-Up is defined as follows:
- Improves the investor returns consistently over a significant historical period of testing compared to a buy-and-hold strategy.
- That no additional investor capital will be required beyond the initial lump sum, and all trading costs are factored.
- Manages the portfolio risk profile to not exceed the volatility of the original buy-and-hold strategy and preferably will be less volatile (a double win)
We need to be clear this is not a “secret” formula for consistently beating the market. We believe in taking an evidence-based approach to investing within a diversified portfolio and rebalancing strategy. The data shows that you can grow your investment pot over the long-term and squeeze further value by rebalancing the Golden Giants portfolio. We’ll explore other portfolios in future equily Power-Ups.
None of this article constitutes financial advice. Consumers should seek advice from a qualified and regulated Financial Advisor in your country prior to and when investing in financial markets. The purpose of this insight article is to explore different model portfolios demonstrate the features and functionality of the equily platform to generate superior portfolio returns using smart rebalancing and historical testing.

Helen Lawton
equily co-founder
A Cambridge graduate, Helen worked at the Bank of England for ten years in various roles, including working for the now-Governor, Andrew Bailey. Helen worked in the area of the Bank responsible for banknotes, as an economist working for the Monetary Policy Committee, and in the aftermath of the 2008 global financial crisis, she worked in the area of the Bank responsible for financial stability. Helen has worked as a senior analyst in Holland, Hahn & Wills, a boutique wealth management firm based in England.
Helen’s research into sensible investing was the foundation for equily’s conception.

0 Comments